Whole Foods Market, Inc – (NASDAQ: WFM) Earnings Beat, Rev’s Lower
A Hole in Whole Foods, Inc. Stock Price
Yesterday, May 7th, 2015, Whole Foods Market , Inc (Nasdaq: WFM), in reaction to yesterday’s earnings announcement after the close , shares of this healthy food company/supermarket chain operator, (not necessarily only organic in food quality nature) – dropped a whopping 9.74 percent or $ -4.65 to close at $43.07 after selling down to $41.03 or 11 % at its lowest point intraday. Whole Foods traded 31.6 million shares- more shares today than it has since May of 2014 in extremely heavy trading on the Nasdaq Stock Market Exchange.
While earnings beat analysts’ estimates, revenues fell short; sending its shares plunging in aftermarket trading Wednesday and continuing into yesterday’s trading session.
Why the Decline?
While not too significant in dollar terms- the significance does however have impact in the fact that competition is ramping up from competitors not normally associated with healthy food offerings in their supermarkets; namely, Kroger,(NYSE:KR), Wal-Mart Stores (NYSE:WMT), and Sprouts Farmers Market (Nasdaq:SFM). If you walk into many of these names lately you’ll see small sections attributed solely to a healthier food choice for customers.
One such name that started years ago is King Kullen but never seemed to put a dent in Whole Foods operations.
Another name that may sound familiar is Trader Joe’s (privately held) – a very popular small chain supermarket that follows closely the business plan of Whole Foods Market albeit at a lower price point for customers.
The Chart
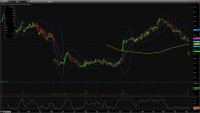
Below, please see the daily bar chart for Whole Foods Market from May 2014 until the present. You can see that the share price is not unfamiliar with extreme price gaps. The one price-gap previous to yesterday’s extreme sell-off was met with heavy support and wound up rallying for many months after. It will be interesting to see if yesterday’s severe sell-off will ultimately be met with buying as well -as some investors, traders and longer term players may find extreme value at this price point.


